Introduction to PlanetServer-2
PlanetServer-2 is the Planetary section of the H2020 EC-funded project Earth Server-2 aiming at access and exploitation of Big Earth Science data. The project comprises various services related to specific domains. The planetary section of the project is developed at Jacobs University Bremen and it focuses on the visualization and analysis of space mission data on solid planets and moons, using Open Geospatial Consortium (OGC) standards. The web GIS client has been developed in a minimalistic and non-invasive way having as a result a very intuitive user-client interaction. We use NASA’s WebWorldWind, a JavaScript open-source 3D virtual globe API, as a canvas to display images and let the user interact with them. The technology that allows PlanetServer-2 to analyze data online is rasdaman, an Array DataBase Management System (DBMS) capable of storage and retrieval of multidimensional data. Rasdaman is an Array DBMS offering features such as query languages, query optimization and parallelization on n-D arrays. The Rasdaman data model consists of n-D arrays with individually fixed or variable boundaries. The query language, ”rasql”, is an ISO SQL extended language allowing declarative array selection and processing with multidimensional operators. The array is partitioned (tiled) and stored along with the processing engine, thus reducing the query response time. OGC standards such as the [WCPS] (http://www.opengeospatial.org/standards/wcps), are implemented in the PetaScope component. For those interested into knowing a bit more about rasdaman can try the online workshop with exercises and the webinars.

First steps in PlanetServer-2
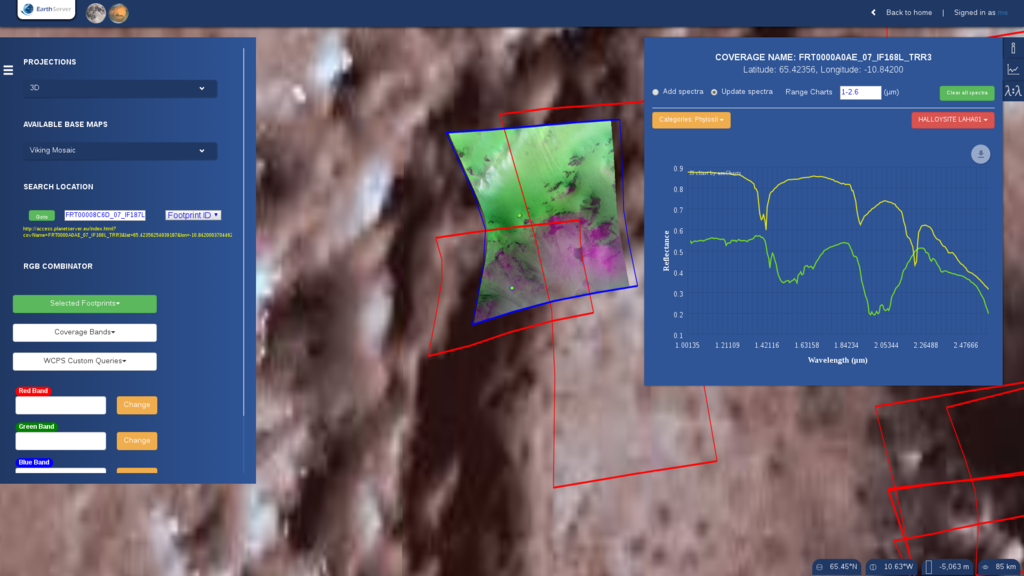
The first thing the users will see when they open the web client will be a Martian globe containing a set of polygons representing CRISM footprints. You can zoom in, zoom out, spin and tilt the globe using your mouse.
… the data
PlanetServer-2 provides access to two different hyperspectral datasets: Compact Reconnaissance Imaging Spectrometer for Mars (CRISM) and Moon Mineralogy Mapper (M3).
CRISM
The Martian dataset is formed by more than 9TB of data (+20k images) containing Target Reduced Data Record (TRDR) CRISM images. CRISM images have two different spectral range: the short wave ranging from 0.3 to 1 microns and the long wave ranging from 1 to 4 microns. All the images have been preprocessed using CAT on ENVI in order to apply map projection and atmospheric correction.
M3
The Lunar dataset is formed by around 3TB of data containing (M3) images. The images have been preprocessed using ISIS and GDAL in order to apply atmospheric correction and map projection. The spectral range of the M3 dataset is from 0.430 to 3 microns.
DTMs
PlanetServer-2 gives the opportunity to display a DTM by tilting the globe when the user is in 3D mode. The following videos show how the DTMs look in Mars and the Moon.
… the tools
- Projections: The user can select the 3D globe or between different 2D projections: equirectangular, geographic, north and south polar stereographic, and north and south polar gnomonic.
- Base Maps: Two base maps per planetary body are provided. The dropdown menu will give access to select which one the user wants to deploy.
- Search engine: The user can search by location, image ID and coordinates.
- RGB Combinator: The RGB combinator allows the user to select a list of bands and assign them to a certain channel (RGB). We also provide Viviano-Beck CRISM products that can be also loaded to a certain channel. Once the channels are selected the user can run the query and the output image will be shown in the globe.
- Spectral plot: In order to analyze the spectra PS2 provides a plotting. The user only needs to click on the location inside the image and the spectra will be shown in the plot dock.
- Band ratio plot: When analyzing spectra a common practice is to ratio the spectra in order to enhance possible absorption bands. PlanetServer-2 provides the possibility, in a dedicated plot dock, to select the numerator and denominator and compute ratioed spectra.
PlanetServer-2 (and beyond!)
PlanetServer-2 has been developed to be accessed through the web client but, although being useful for a first analysis, a full integration in existing pipelines would allow potential users to pursue their investigations without leaving their pipelines. For that reason, we are developing a Python API in order to create and query Vivano-Beck products. This API can be easily integrated in existing pipelines so the users can obtain, process and analyze CRISM images in python.
… more to come
This is just the first introductory entry about PlanetServer-2. In future posts we will describe different pipelines to analyze CRISM imagery using the web client and the Python API. Stay tunned!
All the code used in PlanetServer-2, including the web client, is available in github
If you have questions, or want more details you can reach us on Twitter or in slack: Angelo(@arosp) and Ramiro (@ramiromf).