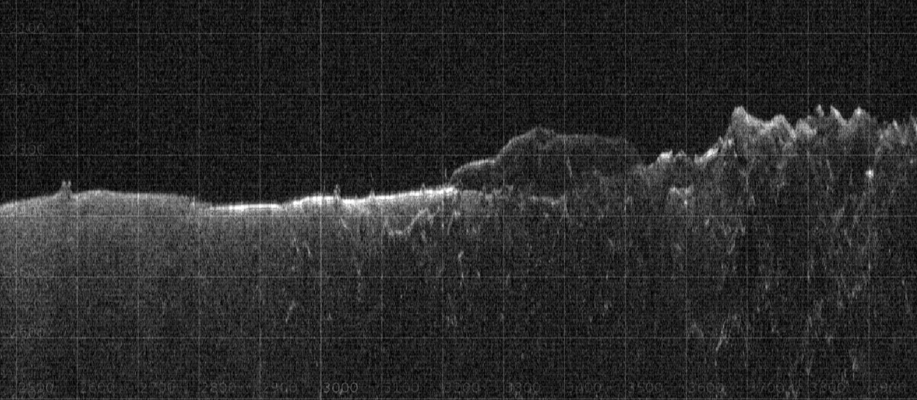
Ground penetrating radars (GPR) are able to probe the subsurface of a planet from its orbit. GPRs collect data by sending electromagnetic (EM) pulses toward the surface and listening to the return echoes occurring at the dielectric discontinuities on the planet’s surface and subsurface. Two such radars are orbiting around Mars: MARSIS on board ESA’s Mars Express (http://sci.esa.int/ESA_SP-1240) and SHARAD on board NASA’s MRO (http://mars.nasa.gov/mro/mission/instruments/sharad/), they are collecting data since about 10 years covering a large fraction of the Mars surface.
The data products (Radargrams) are matrices where the x-axis spans different sampling points on the planet surface and the y-axis is the power of the echoes over time in the listening window. No standard way to manage this kind of data is established in the planetary science community and data analysis and interpretation require very often some knowledge of radar signal processing.
The QGIS plug-in
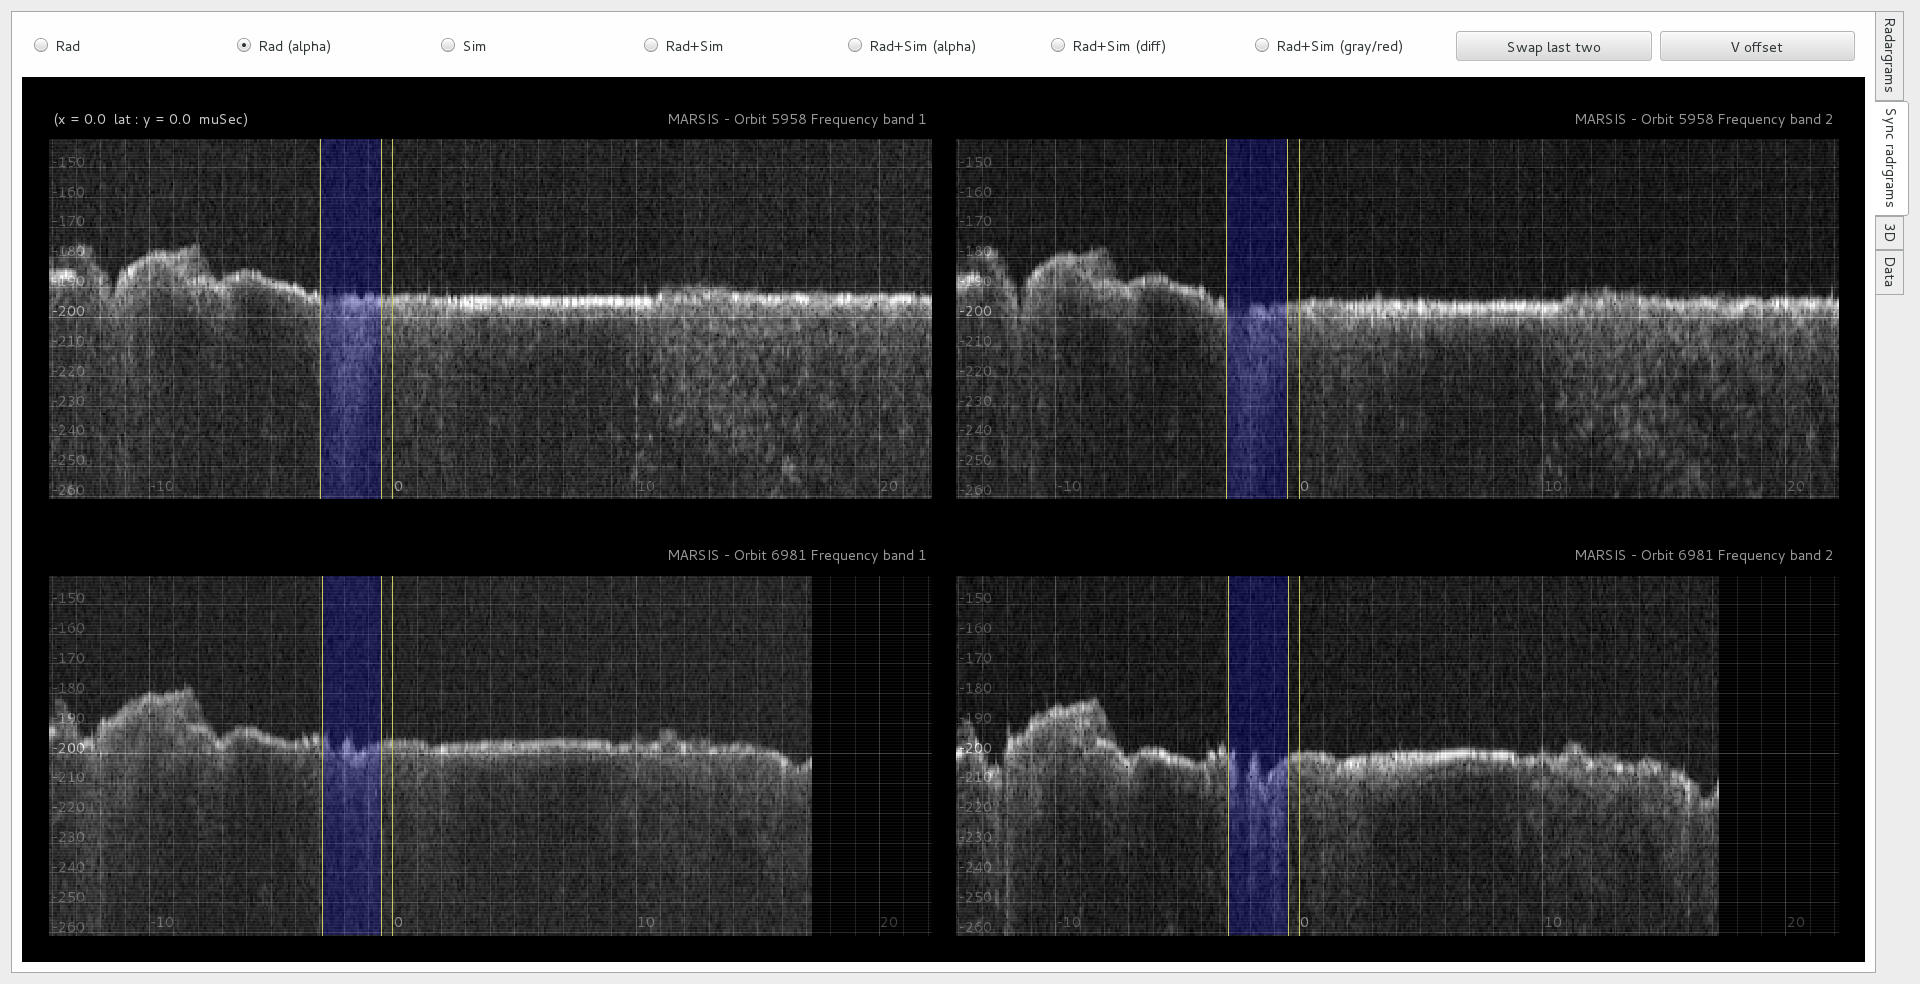
Last year we started the development of a plug-in for the QGIS software (http://www.qgis.org) to provide the ability to easily visualize the radargrams from the aforementioned instruments. It is written in python and uses the pyqtgraph libraries (http://www.pyqtgraph.org/) for plots rendering.
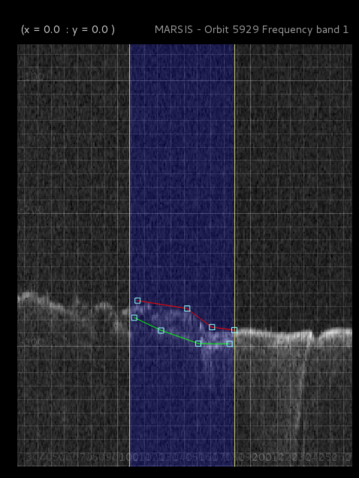
By selecting the data of interest on the main QGIS map, the viewer can show radargrams from several orbits simultaneously. Data selected on the map are highlighted on the radrgram, that can be zoomed and panned. The two operating frequencies are visualized for the MARSIS data. A synchronized view is available to show radargrams from different orbits aligned by latitude to easily inspect feature in close, quasi-parallel orbits. Highlighted region on the radargrams can be moved to highlight the corresponding data on the QGIS map. Features include manual subsurface structure identification, saving and editing, subsurfaces depth measurement and a pseudo 3D viewer.
SHARAD radargrams are fetched by default from the official data repository. Since MARSIS level 2 data release is ongoing, a local MARSIS radargrams repository is currently needed. As MARSIS data will be released, the official repository will become the default source for the plug-in.
More information are available in the plug-in installation and user’s guide.
MARSIS and SHARAD track DB
To properly select the radargrams to show, the viewer rely on a MARSIS and SHARAD tracks database we provide at EPFL’s Space Engineering Center. It is a PostgreSLQ + PostGIS DB you can connect to with QGIS or using GDAL’s utilities (http://www.gdal.org/).
Tracks data include geometric data, relevant metadata and, for MARSIS, quality indexes for each acquisition frequency band.
More information are available here.
It’s free software!
The viewer code is available on GitHub under the GNU GPL v2 (https://github.com/eSpaceEPFL/marsissharadviewer). Download it, use it, modify it and please share the improvements!.
Let’s keep in touch
For any information or feedback please write to
Federico Cantini (federico.cantini@epfl.ch) Anton Ivanov (anton.ivanov@epfl.ch)
Acknowledgment
The research leading to these results has received funding from the European Union’s Seventh Framework Programme (FP7/2007-2013) under iMars grant agreement n° 607379. http://www.i-mars.eu/


